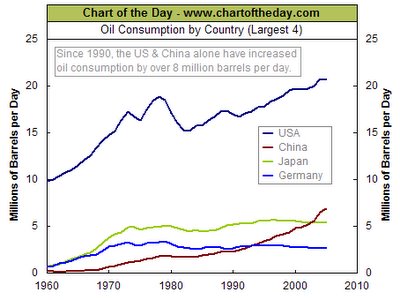
Certainly, the US uses lots of oil. Throwing in Germany (population 82,431,390) without including the rest of Europe is a little odd. For comparison, Japan has 120.000.000 people, the US over 300,000,000 and China has 1.3 billion. Europe has a population of around 710,000,000 (EU alone is 456,953,258).
Now, let's have a chart that shows oil consumptiono on a per capita basis. The US may still lead, but I bet that there are lots of others in the running...
UPDATE: Found a chart of oil consumption per capita here. US is 17th (behind 16 small, mostly island places) with .677 barrels per day. Canada is 19th at .668. Germany is 53rd at .325.
On the other hand, the US is the world's 3rd largest oil producer, according to this. Germany is 47th, in case you were wondering. But then there are the following charts from here and here:


An explanation here:
The industrialized countries are the largest consumers of oil but until 1998 had not been the most important growth markets for some years. The countries of the Organization for Economic Cooperation and Development (OECD), for instance, account for almost 2/3 of worldwide daily oil consumption. In contrast, however, oil demand in the OECD grew by some 11 percent over the 1991-97 period, while demand outside the OECD (excluding the Former Soviet Union) grew by 35 percent. The Former Soviet Union presents a special case. The collapse of the Russian economy that accompanied the collapse of Communism led to a decline in oil consumption of more than 50 percent over the 1991-98 period.
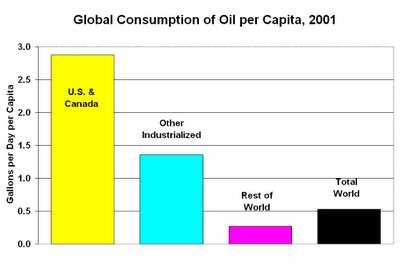
The developed economies use oil much more intensively than the developing economies, and Canada and the United States stand almost alone in their consumption of oil per capita (see graph). For instance, oil consumption in the United States and Canada equals almost 3 gallons per day per capita. (The difference is these countries' transportation sectors, with their dependence on private vehicles to travel relatively long distances.) Oil consumption in the rest of the OECD equals 1.4 gallons per day per capita. Outside of the OECD, oil consumption equals 0.2 gallons per day per capita.
Regionally, the largest consuming area remains North America (dominated by the United States), followed by Asia (with Japan the largest consumer), Europe (where consumption is more evenly spread among the nations), and then the other regions. As the regional graphs illustrate, Asia was the region with the fastest demand growth until the 1998 economic crisis in East Asia. The region's economic upheaval is a central reason for the oil price collapse of 1998.
The United States and Canada use oil more for transportation than for heat and power, but the opposite pattern holds for most of the rest of the world: most regions use more oil for heat and power than for transportation. As a result, global demand for oil is highest in the Northern Hemisphere's cold months. There is a swing of 3-4 million barrels per day (some 5 percent) between the 4th quarter of the year, when demand is highest, to the 3rd quarter, when it is lowest. (The precise amount varies from year-to-year, depending on weather, economic activity and other factors.) While the 4th quarter is not the coldest in any region, estimated demand calculations are swollen by the traditional stock building that occurs during the period.
Demand for crude oil is derived from the demand for the finished and intermediate products that can be made from it. In the short-term, however, demand for crude oil may be mismatched with the underlying demand for petroleum products. This misalignment occurs routinely as a result of stock changes: the need to build stocks to meet seasonal demand, for instance, or the desire to reduce stocks of crude oil for economic reasons. In the longer term, blending non-petroleum additives into petroleum products (such as ethanol or other oxygenating agents into gasoline) can also reduce crude oil demand relative to demand for finished products.

No comments:
Post a Comment